Support → Reports → Ticket Statistics
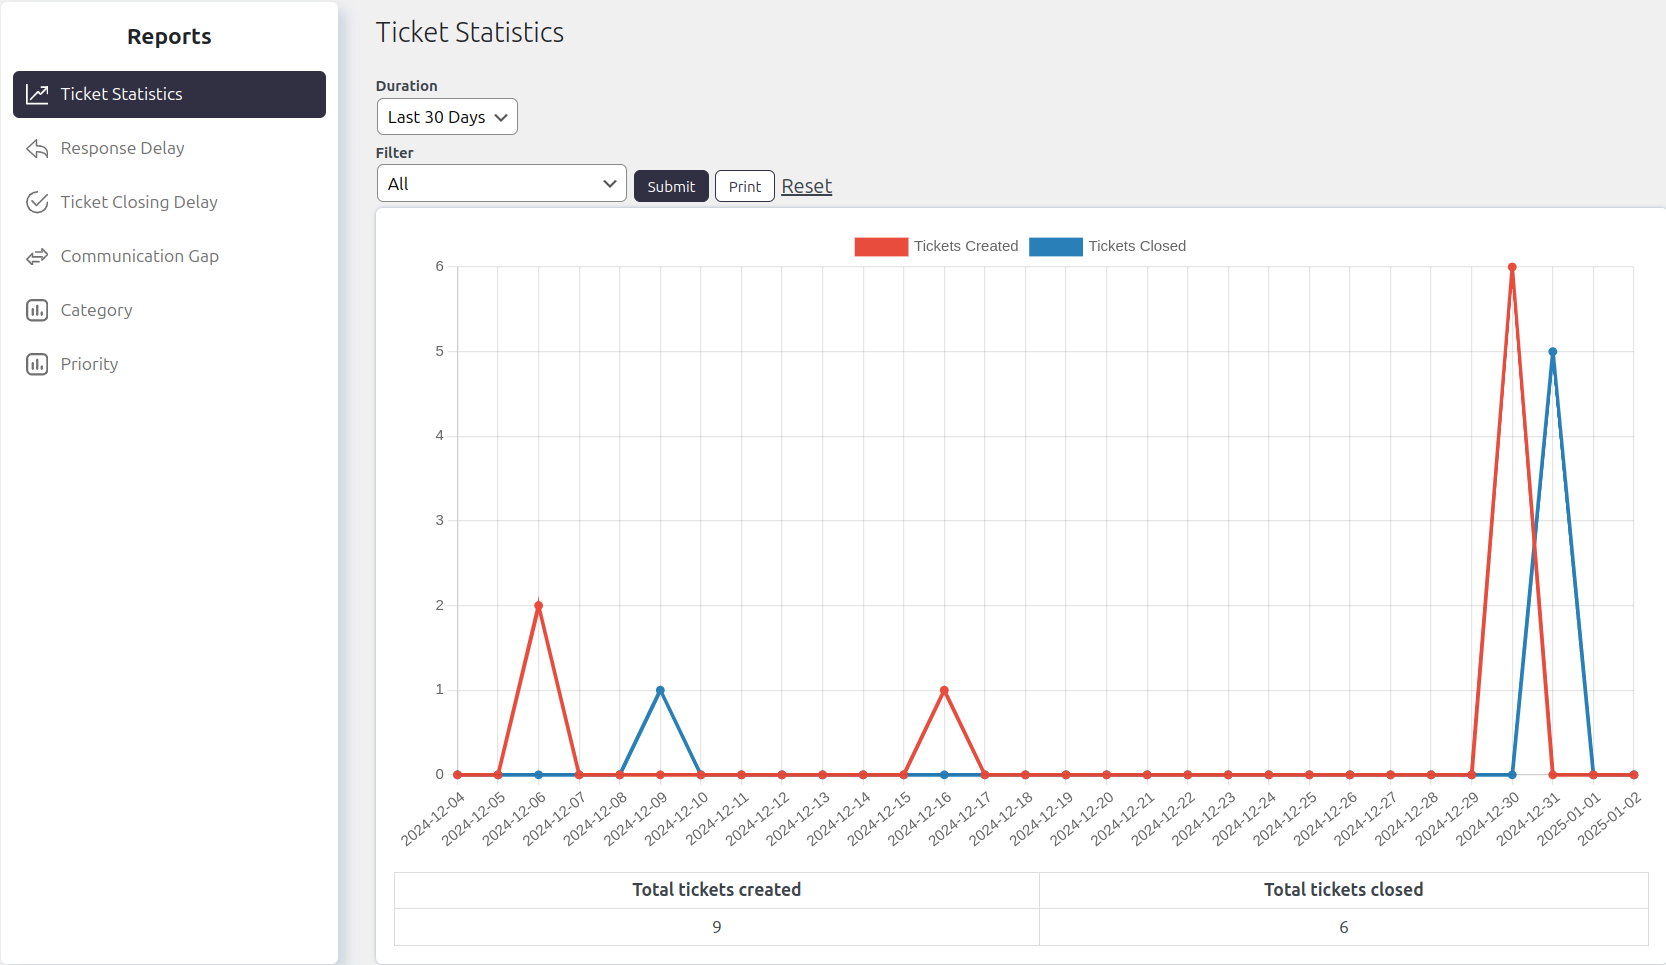
The graph shows you the trend of the number of tickets created in the helpdesk and the number of tickets closed in the selected duration. This report gives you two types of data: the number of tickets created and a number of tickets closed.
Number of tickets created
The total number of tickets created in the selected duration.
Number of tickets closed
The total number of tickets closed in the selected duration. There is an option to choose duration like last 30 days, this week, last quarter, etc. Also, you can generate reports for custom dates where you can select date intervals. If you want to generate a report for tickets of a specific category, priority, status, or any based on any other custom fields or default fields then you can use a custom filter. The custom filter allows you to set multiple conditions based on ticket fields.