
Overview
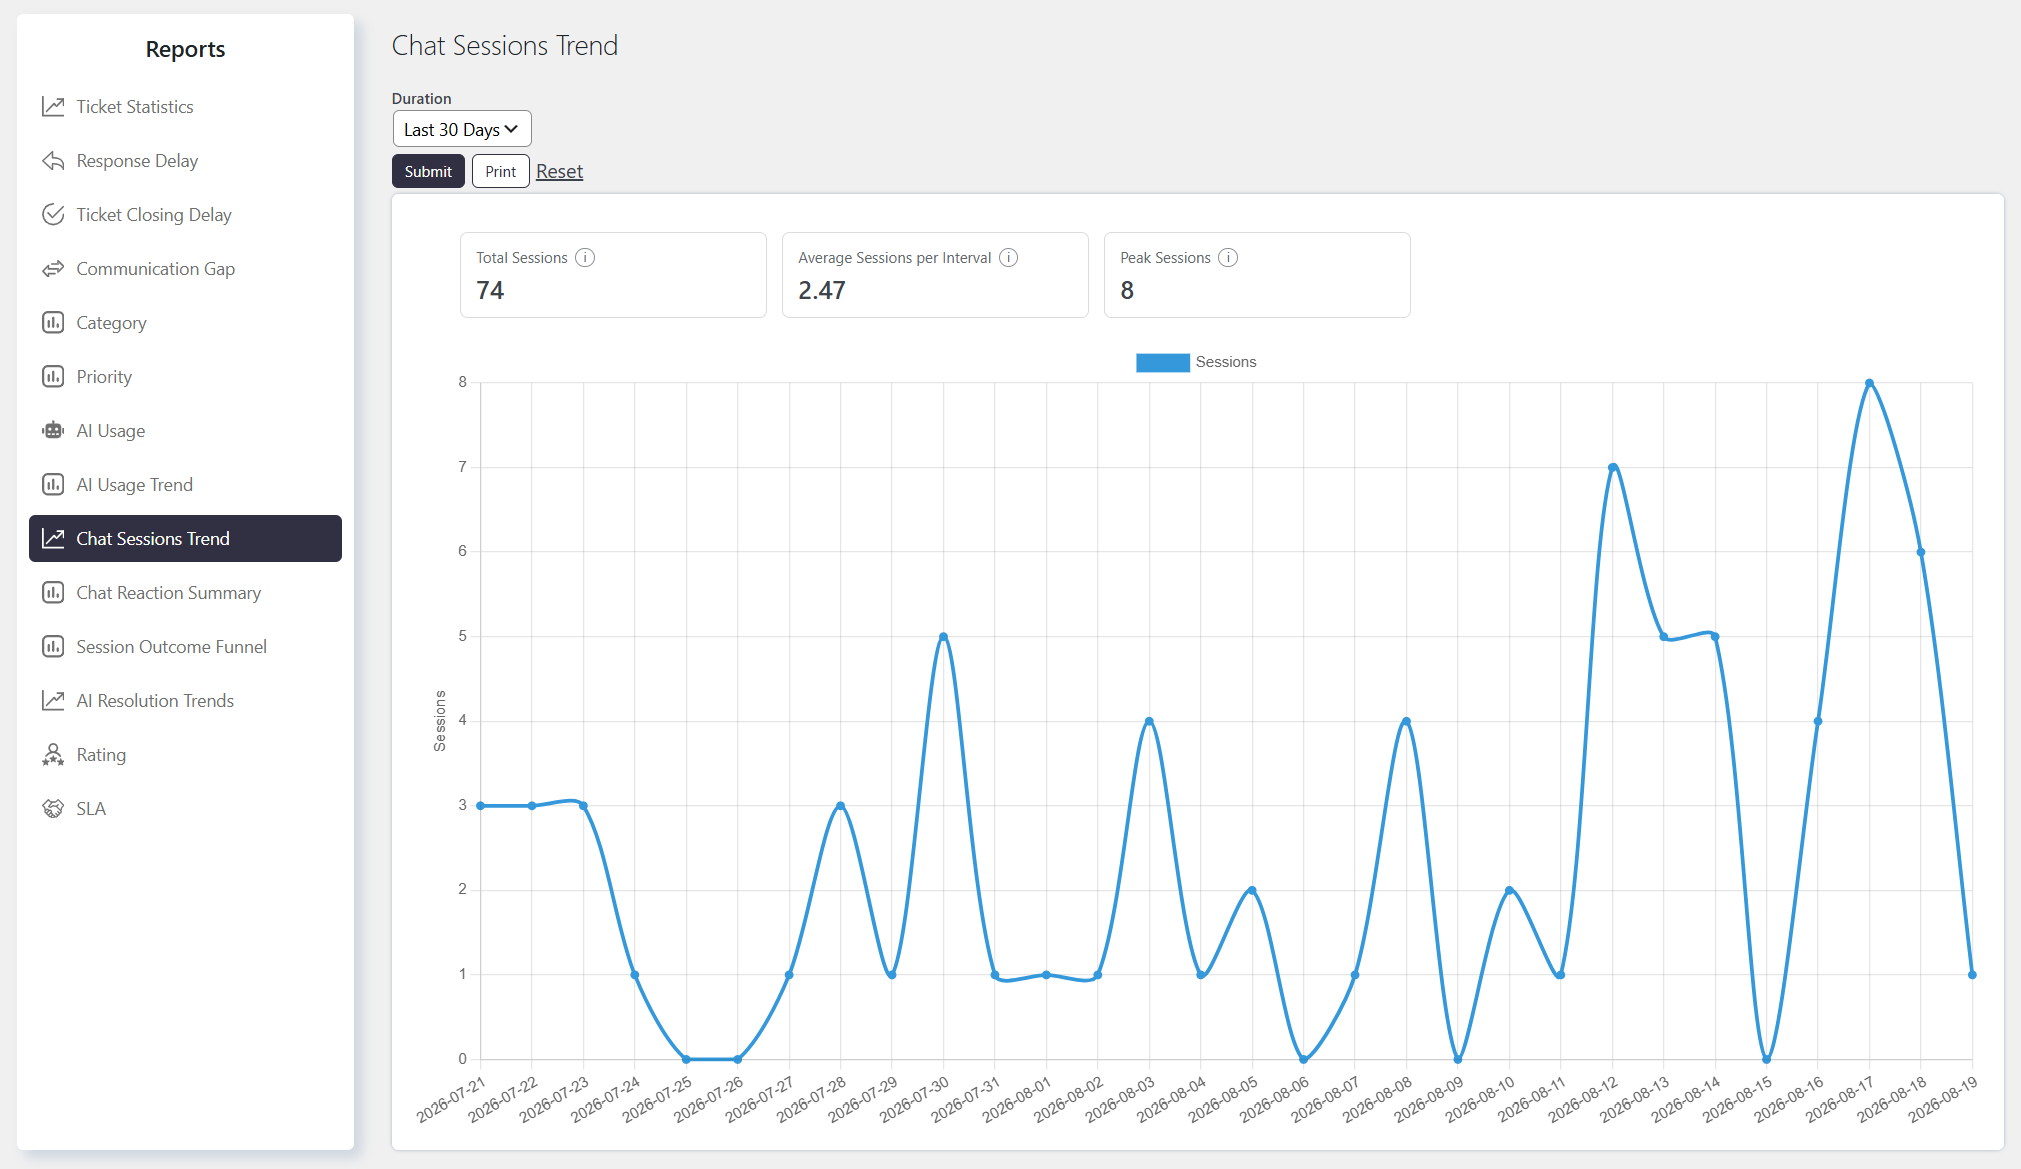
The Chat Sessions Trend report tracks how many chatbot sessions are being started over time. It plots session volume across your selected date range, giving you a simple view of chatbot engagement trends — whether usage is growing, holding steady, or spiking — without breaking sessions down by outcome (resolved, escalated, or abandoned).
Where to Find
Go to Support → Reports → Chat Sessions Trend
How It Works
The report displays a graph with the following types of data:
Sessions — the count of chatbot sessions started in each time bucket, regardless of their final status (active, resolved, handed off, or abandoned)
This is plotted as a single-line chart over the selected period, bucketed by day/week/month/year depending on the duration you choose.
Filtering the Report
You can generate the report for different time periods, such as:
- Last 30 days
- This week
- Last quarter
Notes / Tips
- This counts sessions started, not sessions completed or resolved. A session in any state — ongoing, abandoned, resolved by the bot, or escalated to an agent — is counted the same way here. For a resolved-vs-escalated breakdown, use the AI Resolution Trends / Escalation Rate report instead.
- A spike in sessions doesn’t tell you if the bot handled them well. Pair this trend with the Escalation Rate report for the same period to see whether rising volume is also driving more human handoffs.
- Sessions with no messages are still counted. A session record is created as soon as a chat starts, so an abandoned session where the visitor never sent a message still shows up in this count.
- Granularity affects what you can spot. A weekly or monthly view smooths out short spikes (e.g., a burst of sessions during a product outage) — switch to a daily or hourly duration if you’re investigating a specific event.