
Overview
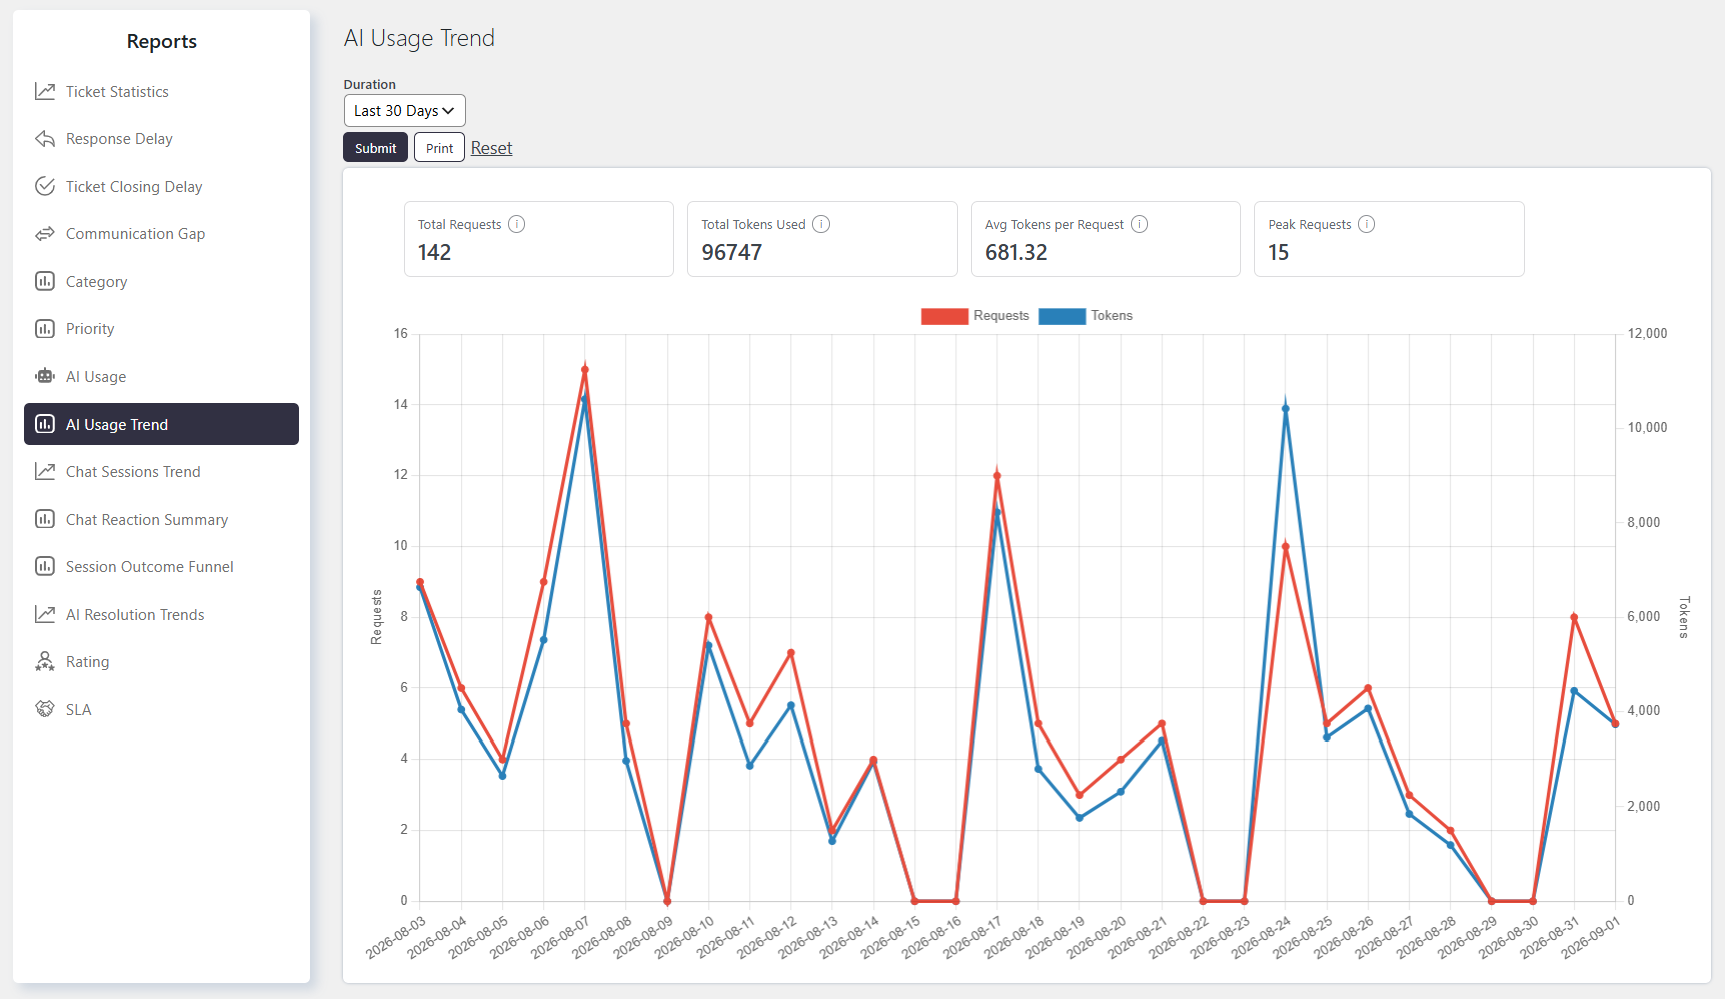
The AI Usage Trend report shows how AI feature usage changes over time. Instead of a snapshot broken down by agent or feature, it plots request volume and token consumption across your selected date range, so you can see whether AI usage is growing, shrinking, or spiking at particular points in time.
Where to Find
Go to Support → Reports → AI Usage Trend
How It Works
The report displays a graph with the following types of data:
- Requests — the count of AI feature calls (Reply Polish, Ticket Summary) made in each time bucket
- Tokens — the total tokens consumed across all AI calls in each time bucket
You can select a predefined duration or choose a custom date range. You can also apply custom filters to generate more specific results.
Filtering the Report
You can generate the report for different time periods, such as:
- Last 30 days
- This week
- Last quarter
Notes / Tips
- Requests and Tokens can move independently. A spike in requests with only a modest rise in tokens suggests many short/simple AI calls; a rise in tokens without more requests suggests fewer but heavier (longer) calls — read the two lines together, not in isolation.
- This is a volume trend, not a per-agent or per-feature breakdown. To see who or what is driving a spike you notice here, cross-check against the AI Usage by Agent & Feature report for the same period.
- Granularity affects what patterns you can see. A daily view will smooth out hour-of-day spikes (e.g., AI usage clustering around peak support hours) — switch to a shorter duration if you’re trying to spot intraday patterns.
- No cost data is shown. Like the Agent & Feature report, this only tracks tokens and requests — apply your provider’s token pricing separately if you need to estimate AI spend over time.