
Overview
The Chat Reaction Summary report shows how visitors rated their chatbot conversations. At the end of each chat session, visitors can mark it as helpful (👍) or not helpful (👎); this report aggregates those reactions over your selected date range, letting you track satisfaction trends and spot periods where the bot’s performance may have dipped.
Where to Find
Go to Support → Reports → Chat Reaction Summary
How It Works
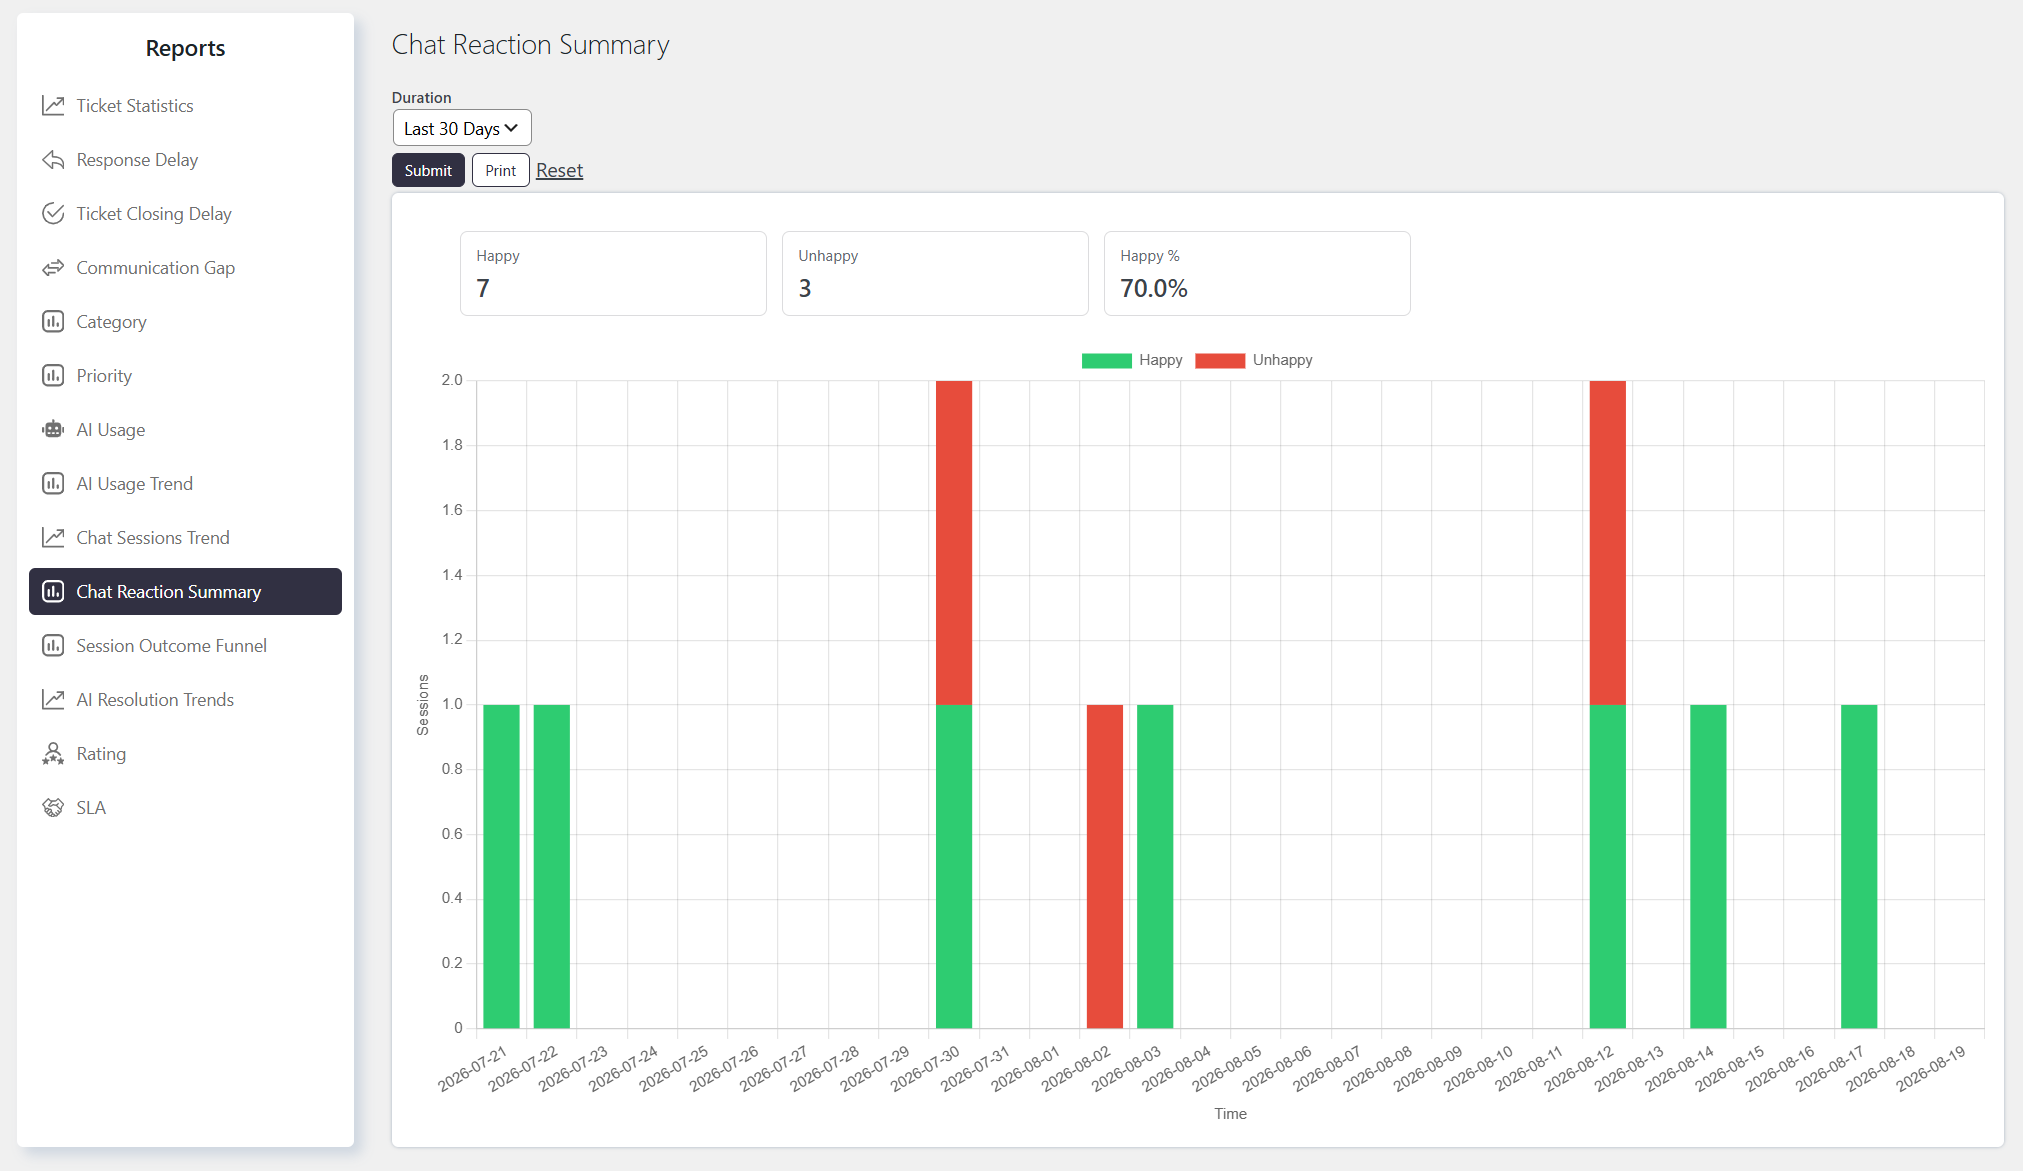
The report displays a graph with the following types of data:
- Happy — count of sessions marked “Helpful” in each time bucket
- Unhappy — count of sessions marked “Not Helpful” in each time bucket
Both are plotted as a stacked bar chart over the selected period, bucketed by day/week/month/year depending on the duration you choose, so you can see reaction volume and the happy-vs-unhappy split at a glance.
Filtering the Report
You can generate the report for different time periods, such as:
- Last 30 days
- This week
- Last quarter
Notes / Tips
- This is a per-session rating, not per-message. Visitors rate the overall conversation once at the end, not each individual bot reply — so this report reflects overall session satisfaction, not which specific response caused a good or bad reaction.
- Sessions with no reaction aren’t counted at all. If a visitor closes the chat without rating it, that session doesn’t appear in either the Happy or Unhappy count — the totals only reflect sessions where a rating was actually given, so a low bar count can just mean low rating engagement, not low chat volume.
- A “Not Helpful” reaction can trigger ticket escalation, so a rise in Unhappy sessions may also show up as increased ticket creation from chat — worth cross-checking against ticket volume if you see a spike here.
- Only the latest reaction is stored per session — there’s no history of a rating being changed, and no neutral/partial rating option exists between Happy and Unhappy.